Quick and Dirty Python Malware Static Analysis script
I'm still having fun going through the Practical Malware Analysis book but started getting tired of all of the various tools that are presented in this book and other - Malware Analyst's Cookbook and Grey Hat Python books. So I decided to utilize Python scripts to automate the process of analyzing Malware by starting with the PEfile module that I covered in my previous writeup.
I then added the strings command in my script to ensure that I was able to read the string information utilizing my python script, and I was also able to locate a great power point presentation from - "Win32 Static Analysis in Python" by Ero Carrera Sabre Security GmbH (http://www.recon.cx/en/f/lightning-ecarrera-win32-static-analysis-in-python.pdf). They pretty much provide all of the code in this presentation for the other portions of the script -
#Section Inspection
#Inspecting the Headers
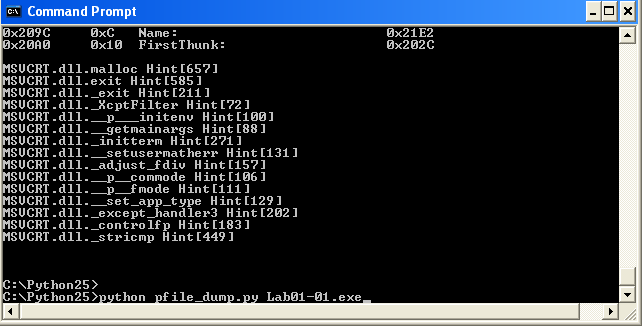
#Imports
I have yet to see the def H(data): function work and I am curious on its functionality and will test on other Malware examples. (Stay Tuned)
Now that I have great start for analyzing Malware statically on a 32 bit environment, I will continue refining this script to make the output prettier and to file out some of the garbage.
To Do:
- Submit the file to virustotal or other online submissions - the code is in the Malware cookbook
- Perform a HASH and update my db with values
- Filter out garbage data whenever possible
- Work with the various debuggers including immunity debugger and to try and incorporate the same process of scripting most of the actions required to analyse malware.
- Start working with the Debuggers
Working version of my script
###########################################################################
import pefile
import math
import os
#pe = pefile.PE (sys.argv[1])
path = 'C:/admin/Practical Malware Analysis Labs/BinaryCollection/Chapter_3L/Lab03-01.exe'
pe = pefile.PE (path)
def H(data):
if not data:
return 0
entropy = 0
for x in range(256):
p_x = float(data.count(chr(x)))/len(data)
if p_x > 0:
entropy += - p_x*math.log(p_x,2)
return entropy
#Section Inspection #############################################################
#This will print strings to the screen - the strings must be in your windows path
try:
HoldString = os.system("strings " + "\"" + path + "\"")
except: os.error
#################################################################################
print "\n"
print "This will print the Section inspection information"
print "\n"
for section in pe.sections:
print (section.Name,
hex(section.VirtualAddress),
hex(section.Misc_VirtualSize),
section.SizeOfRawData)
#Inspecting the Headers
###############################################################################
print "\n"
print "This will print the Headers in the file"
print "imageBase -->", hex(pe.OPTIONAL_HEADER.ImageBase)
print "AddressOfEntryPoint -->", hex(pe.OPTIONAL_HEADER.AddressOfEntryPoint)
print "NumberofSections -->", hex(pe.FILE_HEADER.NumberOfSections)
print "\n"
################################################### Section Data File
for section in pe.sections:
try:
print section.Name
print H(section.data)
except:
print ("No Section Data File")
# Imports
###############################################################
print "\n"
print "This will print the import of the file"
print "\n"
for entry in pe.DIRECTORY_ENTRY_IMPORT:
print entry.dll
for imp in entry.imports:
print '\t' , hex(imp.address), imp.name
############################################################################3